Graphical Modeling of Process Groups and Processes (Quam 5.3)
Processes and process groups can also be modeled directly as Quam drawings.
Quam is based on the graphical objects of the BPMN notation in the process representation, but uses only a significantly reduced set of symbols in the standard Quam flowchart. In order to be able to use further graphical objects of the BPMN, an appropriate configuration must be made, which usually cannot be carried out by the end user. Which BPMN version is supported depends in particular on the Visio version (Visio 2010 supports BPMN 1.2). For limited support of certain elements of BPMN see also chapter Swimlane Modeling (Quam 5.3).
For graphical modeling, open the corresponding process element and proceed as follows:
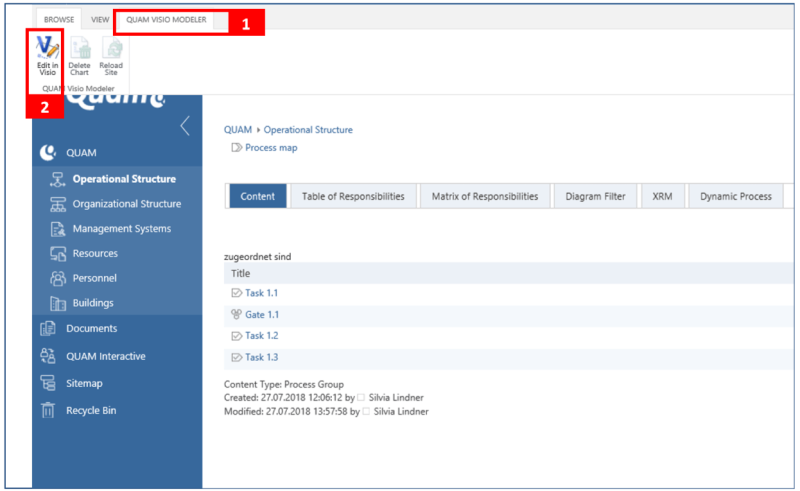
Select the |QUAM Visio Modeler tab (1).

To create a drawing or make adjustments to an existing drawing, click the |Edit in Visio button (2) to open the drawing area in Microsoft Visio.
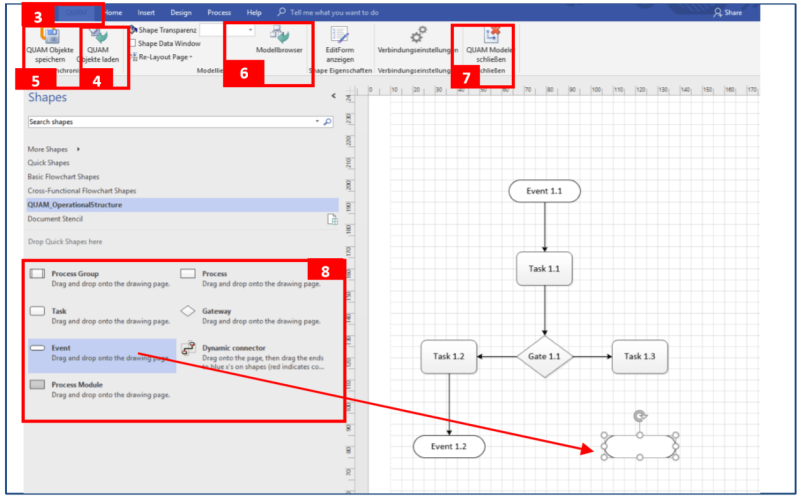
In Visio, open the |QUAM (3) tab in the upper navigation menu. Here you will find the following important functions:
- Save QUAM objects (4): The Visio drawing is saved in the database. Model objects are created, changed or deleted.
- Load QUAM objects (5): Existing model objects are imported from the database into the drawing.
- Model browser (6): Workspace for integrating existing elements of the process model.
- Close QUAM Modeler (7): Visio is closed without saving the drawing before.

To import elements already created and assigned to the process to the drawing sheet, click |QUAM Load objects (5). The individual objects now appear in the middle of the drawing sheet. To display them accordingly, however, you should rearrange and arrange the shapes. Proceed as described in chapter Layout adjustments of Visio process drawings (Quam 5.3).
To the left of the modeling surface is the template with the available shapes (8). To model the process flow or add further process elements, drag & drop the desired shapes onto the drawing area and arrange them accordingly.
Helpful tips and tricks can be found in chapter Tips for modeling with Visio (Quam 5.3).
A description must be assigned to each process element. To do this, double-click the shapes to open a text field in which you can enter the desired name.
Note: If you delete elements from the drawing area, they remain stored in the database in contrast to modeling in the organizational plan. Only when you save the drawing will the elements be deleted from the database. This function can be used to delete many process elements at once. This behavior depends on whether the Quam Add-On CCM is installed or not. You can find more information about Thmea deletion prevention in the corresponding user manual.
You can edit the properties of the elements after the drawing has been completed. Please read chapter Editing and linking elements (Quam 5.3).
To save the newly created elements in the database, click on the button |QUAM Save objects (4). Close the drawing area by clicking |QUAM Modeler Close (7). The modeled elements are saved as objects in the database and can now be provided with information.

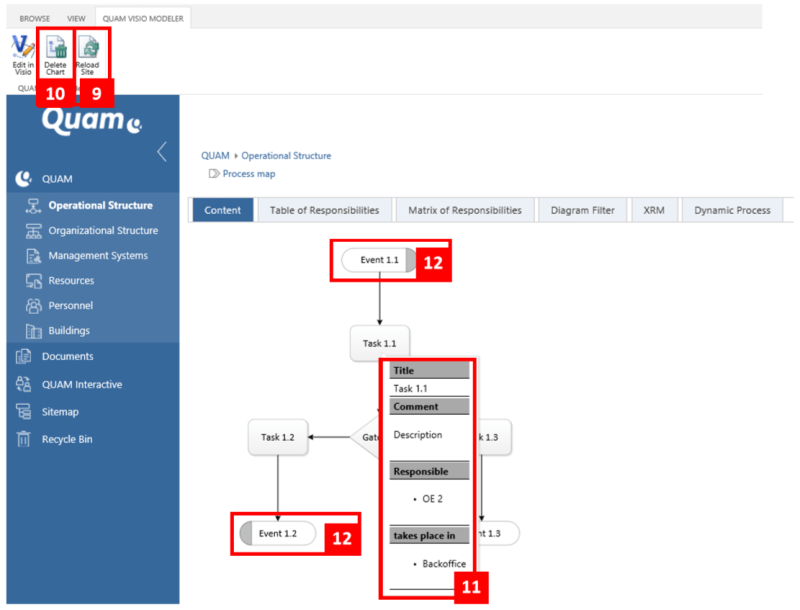
Back in the browser, update the process by clicking |Reload Site (9) to display the drawing. To delete the drawing, click |Delete Chart (10). The elements stored in the data model are then retained. Move the mouse pointer over a shape to get information about it (11). The information displayed can be configured as required.
If an event is a trigger or result of an object, the left or right side of the shape becomes gray (12). By clicking on the grey area, you can see which predecessor or successor the element has. This property is also used for referencing.

The webpart for displaying drawings can have one of 3 different zoom modes: None, Legacy and QUAM. The drawing can be zoomed in and out in the QUAM zoom mode of the plus and minus buttons or the mouse wheel and dragged back and forth with the mouse button pressed. Use the centering zoom button to reset the drawing and center it. If you hold down the CTRL key, you can select an area within the drawing to be zoomed. You get the same function by pressing the box button. The best result is obtained by zooming over the box, if you center the drawing beforehand.
Note: The display of the drawings can vary slightly in different browsers.
Move the mouse pointer over a shape to display information about it (11). The information displayed can be configured as required.
If an event is a trigger or result of an object, the left or right side of the shape becomes gray (12). By clicking on the grey area, you can see which predecessor or successor the element has. This property is also applied to references.
