Graphical modeling of Organigrams (Quam 5.3)
To model an organizational chart with Visio, please proceed as follows:
In the Organizational Plan list, click the element you want to model (for example, organizational chart) and open the |QUAM Visio Modeler (1) tab.
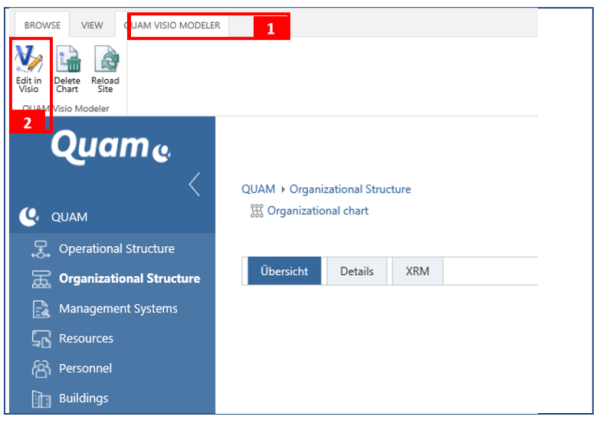
If you want to model a new organigram or make adjustments to an existing one, click |Edit in Visio (2).
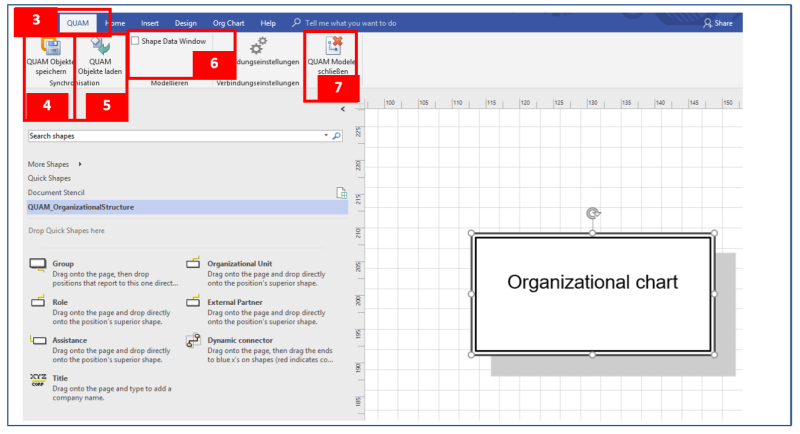
In Visio, open the |QUAM (3) tab in the upper navigation menu. Here you will find the following important functions:
- Save QUAM objects (4): The Visio drawing is saved in the database. Model objects are created, changed or deleted.
- Load QUAM objects (5): Existing model objects are imported from the database into the drawing.
- Window Shape Data (6): Shows additional data of the shapes in a separate window. This allows you to define the number of hierarchy levels and to show or hide level 0.
- Close QUAM Modeler (7): Visio is closed. Unsaved data will be lost.
Before you start, click |QUAM Load objects (5) to import elements that have already been created and assigned to the organizational chart onto the drawing sheet. The layer 0 element - in this case "Organigrams" - and any child objects that may exist will then be loaded onto the drawing area. Arrange the shapes on the drawing sheet as required.
Attention: The following message reminds you once again to load existing Quam objects onto the drawing area first. If you do not press this button, and there are child elements for this object, these will be deleted as soon as you save the drawing.

If you want to add more organizational units, drag & drop the shape from the type Organizational Unit from the template to the shape "Organigram" to assign it to it. It will automatically be placed one layer lower. Double-click on the shape to assign a name and enter the corresponding name.
Note: Do not insert a manual line break as this will cause problems. Line breaks are automatically set according to Visio's shape size.
Further hierarchy levels can be created according to the same principle as described above. Note that the shapes are always placed under of the layer on which they are dragged.
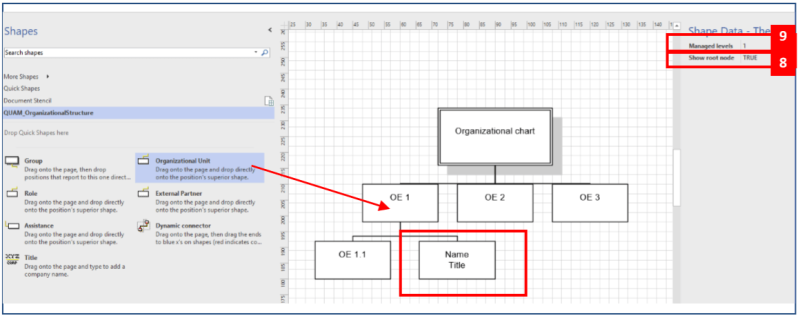
If you want to hide elements of level 0 (Organigrams), open the window Shape Data by clicking on |Shape Data (6) and set the value FALSE in the field "Show root node" (8). If you want to show the shape of layer 0 again, revise this setting.
For Organigrams with more than two hierarchy levels, the number of hierarchy levels drawn must be specified in order to avoid the following error message:
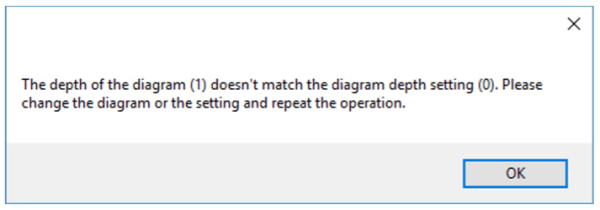
In the Shape Data (6) window, enter the number of hierarchy levels drawn in the "Managed Levels" (9) field.
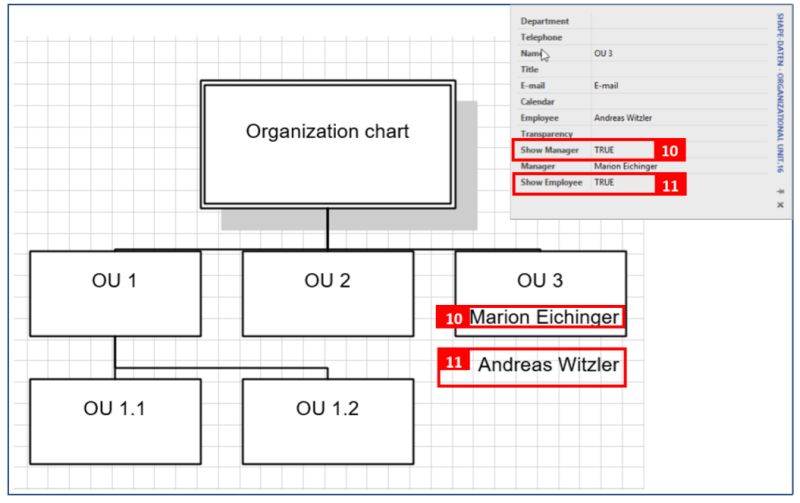
You can display employees and managers of organizational units on the drawing. To do this, select the appropriate shape and make the following settings in the shape data as required:
- Show Manager: TRUE (10) - Shows deposited leaders of the organizational unit.
- Show Employee: TRUE (11) - displays stored employees of the organizational unit
Confirm the |QUAM Load objects button to display the associated contacts on the drawing. Revise the setting if you do not want to display any more contacts.
To temporarily save your data or finish the drawing, click on the |QUAM tab on the button |QUAM Save Objects. After caching, you can continue modeling without reopening the Organigram.
Note: If you delete a shape from the drawing area in the organizational plan, it is also deleted from the database. A confirmation prompt explicitly informs you of this.
Once you have completed the Organigram, close the drawing area by clicking on the |QUAM Modeler close button. Unsaved elements will be lost. Further tips for Visio can be found in chapter Tips for modeling with Visio (Quam 5.3).
Back in the browser, click on |Reload Site (12) to update the organization chart and display the drawing. Move the mouse pointer over a shape to get information about it (13). The information displayed can be configured as required.
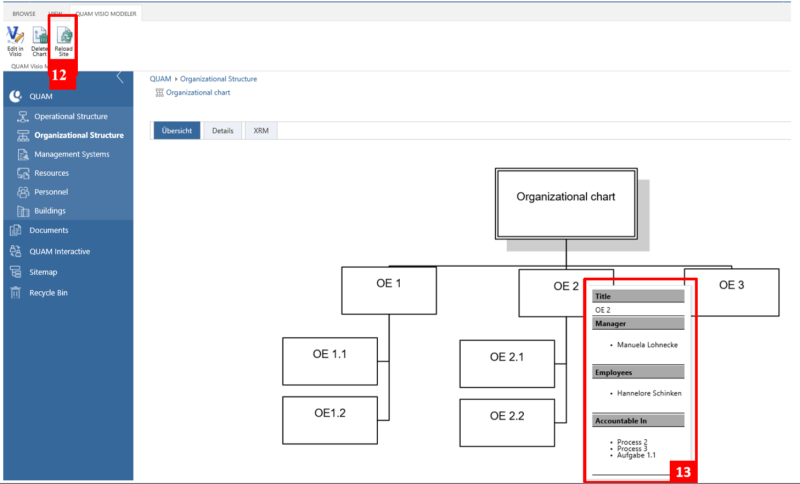
The webpart for displaying drawings can have one of 3 different zoom modes: None, Legacy and QUAM. In QUAM zoom mode the drawing can be zoomed in and out using the plus and minus buttons or the mouse wheel and dragged back and forth with the mouse button pressed. Use the centering zoom button to reset the drawing and center it. If you hold down the CTRL key, you can select an area within the drawing to be zoomed. You get the same function by pressing the box button. The best result can be obtained by zooming over the box, if you center the drawing beforehand.

Attention: The representation of the drawings can vary slightly in different browsers.
Quam allows you to create area Organigrams for individual organizational units. To do this, open the corresponding area element and proceed as described in this chapter.
To provide newly created organizational units with information graphically, proceed as described in chapter Editing and Linking Elements (Quam 5.3).
